
EIA: This Week in Petroleum - 19 May 2021 - eng Избранное
EIA lowers India’s oil demand forecast because of increasing COVID-19 cases
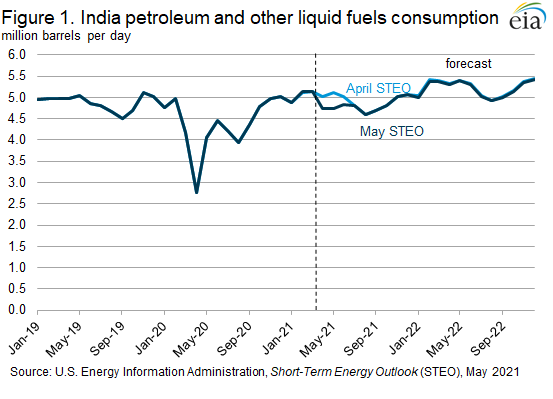
In the May Short-Term Energy Outlook (STEO), we revised down our second-quarter 2021 (2Q21) forecast for India’s consumption of petroleum and other liquid fuels by 0.3 million barrels per day (b/d) (6%) from the April STEO because of a significant increase in COVID-19 cases in that country. We revised total world consumption up slightly because of our upward revisions to consumption in both China and the United States, which more than offset the downward revision in India. The rapid increase in COVID-19 cases in India has led to various travel restrictions in certain regions, reducing consumption of transportation fuels such as gasoline and diesel. In the May STEO, we forecast petroleum consumption in India declined 0.4 million b/d (8%) to 4.7 million b/d from March to April. India’s petroleum consumption data, released after the May STEO’s publication, revealed a similar decline of 0.3 million b/d (6%) over the same period. Reduced travel is expected to continue affecting petroleum consumption through May and June, which we also revised down from the April STEO (Figure 1). We expect India’s petroleum and other liquids consumption to return to previously forecast levels by July, but the forecast is highly uncertain and depends on the current duration of the COVID-19 outbreak and associated travel restrictions.
India is the world’s third-largest consumer of petroleum and other liquid fuels after the United States and China. Although we do not forecast India’s consumption by petroleum product, India’s Petroleum Planning & Analysis Cell (PPAC) of its Ministry of Petroleum & Natural Gas publishes monthly historical consumption data by fuel. India’s data indicate that petroleum consumption returned to pre-pandemic levels by 4Q20, a trend that continued through 1Q21 (Figure 2). By 1Q21, India’s gasoline and diesel consumption combined was 2.4 million b/d, the same as 1Q19 and higher than 1Q20 (Figure 2). Combined gasoline and diesel consumption declined in April 2021 to 2.3 million b/d, reflecting the significant increases in COVID-19 cases and the country’s responses to limit its spread.

Real-time mobility indicators in India suggest even larger declines in travel through mid-May. Recent research from the International Energy Forum suggests that Google mobility data have a high correlation with final gasoline and diesel demand in India. The Google COVID-19 Community Mobility Reports provide daily mobility indicators for most countries relative to a baseline period of mobility from January 3, 2020, through February 6, 2020. The reports provide data on the change in the number of visits to groups of places such as parks, transit stations, or essential services—including grocery stores and pharmacies. Although these data have limitations, particularly because the data rely on users who self-select to allow their mobile phone locations to be reported to Google, the timely nature of the data can provide guidance on trends in travel.
Except for Google’s Residential category, which represents the percentage of time spent at home relative to the baseline period, all other categories represent the percentage change in number of visitors to the destination category compared with the baseline. As of May 15, 2021, India’s national seven-day moving average of time spent at home is up 26% from the baseline, which is similar to levels that Google mobility data recorded during significantly reduced travel in April 2020 (Figure 3). Travel to various destinations that Google tracks has declined significantly over the past several weeks, including travel to the workplace and grocery stores, likely reflecting the country’s responses to the outbreak. Figure 3 represents the national average trips to various destinations, and the change in mobility in recent weeks varies considerably by region and city within India. The drop in mobility is consistent with large declines in gasoline and diesel demand, but the extent of the decline will depend on how long these conditions last and how severe the country’s responses to the outbreak ultimately become.

Despite our upward revisions to global demand in the May STEO, oil demand in India presents a downside risk to our forecast because the effect of increased COVID-19 cases on oil demand provides considerable uncertainty. In addition, India relies heavily on crude oil imports, so India’s declining consumption will also significantly affect its trading partners. India has recently been diversifying its sources of crude oil imports as OPEC members have cut production. The United States, for example, has increased crude oil exports to India in recent years, reaching a record high of 0.6 million b/d in December 2020. Future COVID-19 case counts and their ultimate effects on mobility and transportation fuel in India are highly uncertain. We will continue to adjust our outlook for India’s oil consumption in the coming months as official data are released and the responses to COVID-19 become clearer.
U.S. average regular gasoline and diesel prices increase
The U.S. average regular gasoline retail price increased nearly 7 cents to $3.03 per gallon on May 17, $1.15 higher than the same time last year. The Gulf Coast price increased more than 11 cents to $2.78 per gallon, the East Coast price increased nearly 8 cents to $2.94 per gallon, the Rocky Mountain price increased nearly 7 cents to $3.13 per gallon, the Midwest price increased nearly 5 cents to $2.91 per gallon, and the West Coast price increased nearly 3 cents to $3.68 per gallon.
The U.S. average diesel fuel price increased more than 6 cents to $3.25 per gallon on May 17, 86 cents higher than a year ago. The East Coast and Midwest prices each increased nearly 7 cents to $3.23 per gallon and $3.20 per gallon, respectively, the Gulf Coast price increased more than 6 cents to $3.03 per gallon, the Rocky Mountain price increased more than 5 cents to $3.36 per gallon, and the West Coast price increased more than 4 cents to $3.74 per gallon.
Propane/propylene inventories rise
U.S. propane/propylene stocks increased by 0.4 million barrels last week to 44.4 million barrels as of May 14, 2021, 10.0 million barrels (18.4%) less than the five-year (2016-2020) average inventory levels for this same time of year. Midwest and East Coast inventories each increased by 0.4 million barrels, and Rocky Mountain/West Coast inventories increased by 0.1 million barrels. Gulf Coast inventories decreased by 0.5 million barrels.
For questions about This Week in Petroleum, contact the Petroleum Markets Team at 202-586-4522.
Retail prices (dollars per gallon)
 |
 |
| Retail prices | Change from last | ||
|---|---|---|---|
| 05/17/21 | Week | Year | |
| Gasoline | 3.028 | 0.067up | 1.150up |
| Diesel | 3.249 | 0.063up | 0.863up |
Futures prices (dollars per gallon*)
 |
 |
 |
|
| Futures prices | Change from last | ||
|---|---|---|---|
| 05/14/21 | Week | Year | |
| Crude oil | 65.37 | 0.47up | 35.94up |
| Gasoline | 2.127 | 0.000 | 1.157up |
| Heating oil | 2.036 | 0.025up | 1.116up |
| *Note: Crude oil price in dollars per barrel. | |||
Stocks (million barrels)
 |
 |
 |
 |
| Stocks | Change from last | ||
|---|---|---|---|
| 05/14/21 | Week | Year | |
| Crude oil | 486.0 | 1.3up | -40.5down |
| Gasoline | 234.2 | -2.0down | -21.5down |
| Distillate | 132.1 | -2.3down | -26.7down |
| Propane | 44.426 | 0.414up | -18.271down |
Дополнительная информация
- Серия: Госорганы / Зарубежные / EIA / This Week in Petroleum
- Год: 2021
- Месяц: 5
- Источник: EIA


