
EIA: U.S. Energy-Related Carbon Dioxide Emissions by State - 2005-2016 - eng (pdf)

Overview
Energy-related carbon dioxide (CO2) emissions vary significantly across states, whether considered on an absolute basis (Figure 1) or on a per capita basis (Figure 2). Total state CO2 emissions include those from direct fuel use across all sectors, including residential, commercial, industrial, and transportation, as well as primary fuels consumed for electricity generation.
The physical size of a state, as well as the available fuels, types of businesses, climate, and population size and density, all play a role in determining the level of total and per capita emissions. In addition, each state’s energy system reflects circumstances specific to that state. For example, some states have abundant hydroelectric supplies, and others contain abundant coal resources.
This paper examines the factors that contribute to a state’s CO2 profile. The analysis does not attempt to assess the effect of state policies on absolute emissions levels or on current and future trends, nor does it intend to imply that certain policies would be appropriate for a particular state.
The term energy-related CO2 emissions, as used in this analysis, refers to emissions released at the location where fossil fuels are consumed. To the extent that fuels are used in one state to generate electricity consumed in another state, emissions are attributed to the state in which the electricity is generated and fuels are combusted. Attributing emissions to the state consuming the electricity, rather than the state where it is generated, would yield different results. For feedstock uses of fossil fuels, carbon stored in products such as plastics is allocated to the states where the petrochemicals are produced.
The calculations presented in this paper also assume that biomass used by electricity generators, by industries, and by homes and commercial buildings is carbon neutral, with combustion emissions fully offset by land sinks in a sustainable biomass cycle. Emissions may be underestimated to the extent that actual use of biomass energy may not be carbon neutral.
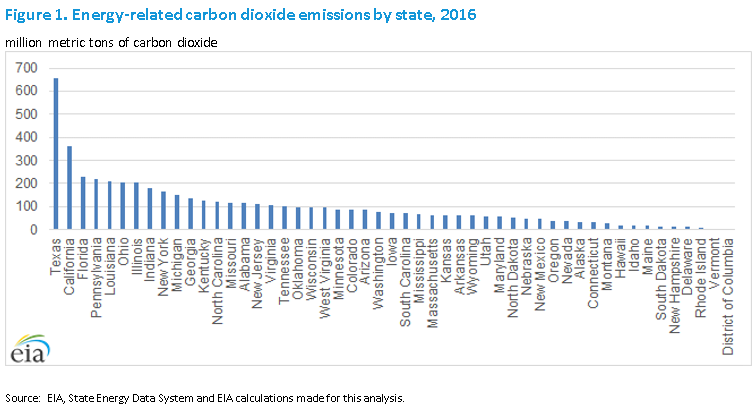
Total state emission levels
In the period from 2005 to 2016, energy-related CO2 emissions fell in 41 states and rose in 9 states (not including the District of Columbia) (Table 1). The largest percentage decrease during that period was Maryland’s 30%—a drop of 24 million metric tons (MMmt)—and the greatest absolute decline was 64 MMmt in Ohio (a 24% decrease). The largest percentage increase during that period was Idaho’s 16% (3 MMmt). Texas, however, experienced the largest absolute increase between 2005 and 2016—52 MMmt (9%). The factors that led to these trends vary by state. In Ohio, for example, during the same period, coal-related CO2 emissions from the electric power sector declined by about 62 MMmt. During this period, the Ohio economy grew in total by less than 8%. In Texas, coal emissions from the electric power sector declined by about 23 MMmt between 2005 and 2016, but the economy grew by almost 42% during that period—and much of this growth was from energy-intensive energy production and petroleum refining.
From 2015 to 2016, 36 states saw a decrease in energy-related CO2 emissions, while 14 experienced an increase. During that period, national emissions decreased by almost 2%. Because of differences in how the national and state data sets are calculated, the total for all states is not the same as the total for the United States. This year, an adjustment factor was introduced to match the total for the United States. This factor is distributed to the states in proportion to each state’s share of the total—see Table 2 for the adjusted values by state. See Appendix A for a comparison of the state- and national-level data used for this analysis. The analysis that appears in this report relied on the unadjusted values
Дополнительная информация
- Серия: Госорганы / Зарубежные / EIA / U.S. Energy-Related Carbon Dioxide Emissions
- Год: 2016
- Месяц: 12 (год)
- Источник: EIA


