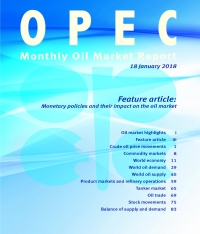
OPEC: Monthly Oil Market Report - January 2018 - eng (pdf) Избранное
Данные отчета устарели. Актуальный отчет за последний месяц находится по ссылке здесь.
Oil Market Highlights
Crude Oil Price Movements
The OPEC Reference Basket (ORB) averaged $62.06/b in December, its highest since June 2015. On the yearly basis, the ORB averaged $52.43/b, a gain of 29% or $11.67/b over the previous year. Oil prices received wide-ranging support from production adjustment resulting from the Declaration of Cooperation
(DoC), strong economic and demand growth, as well as sentiment in the financial markets. ICE Brent increased $1.23 at $64.09/b, while NYMEX WTI increased $1.28 at $57.95/b. The spread between ICE Brent and NYMEX WTI spread narrowed slightly to $6.15/b in December. The Brent, WTI and Dubai market structure held backwardation. Sweet/sour differentials widened in Europe and Asia, and narrowed in the US Gulf Coast.
World Economy
The global GDP growth forecast remains at 3.7% for both 2017 and 2018. US growth was revised up in 2018 to 2.6%, after growth of 2.3% in 2017. Growth in the Euro-zone was lifted to 2.4% in 2017, followed by 2.1% in 2018. Similarly, Japan’s growth was lifted in both 2017 and 2018 to now stand at 1.8% and 1.6%, respectively. India’s somewhat softening momentum led to a slight downward revision to 7.2% in 2018, after growth of 6.5% in 2017. China’s growth is expected to remain at 6.8% in 2017 and 6.5% in 2018.
World Oil Demand
Global oil demand growth in 2017 was revised upward by 40 tb/d to stand at 1.57 mb/d, averaging 96.99 mb/d for 2017. The upward revision was broadly a result of better-than-expected data for OECD Europe and China. For 2018, oil demand growth is anticipated to be around 1.53 mb/d, following a marginal upward adjustment compared to last month’s report, with global oil demand now expected to reach 98.51 mb/d. Non-OECD economies will contribute 1.24 mb/d of the demand growth expected in 2018.
World Oil Supply
Non-OPEC oil supply growth in 2017 has been revised marginally lower to now stand at 0.77 mb/d. The adjustments were mostly due to revisions in the actual data for 4Q17. For 2018, non-OPEC supply growth was revised up by 0.16 mb/d to now stand at 1.15 mb/d, driven by mostly higher growth expectations for the US and Canada. OPEC NGLs are also expected to grow by 0.18 mb/d in 2018, compared to 0.17 mb/d growth in the previous year. OPEC production in December, according to secondary sources, is expected to increase by 42 tb/d to average 32.42 mb/d.
Product Markets and Refining Operations
Product markets in the Atlantic Basin continued to lose ground as refining margins narrowed further. In the US market, losses could be attributed to a weakening in the top and middle of the barrels, which offset gains in the diesel complex, driven by the impact of winter storms on domestic demand. In Europe, product market plummeted with losses seen across the barrel as refinery margins hit a 16-month low due to rising crude prices and supply-side pressure. In Asia, product markets remained at healthy levels amid firm domestic demand.
Tanker Market
Dirty tanker spot freight rates in general did not show considerable gains in December. Average dirty tanker spot freight rates was almost stable from the previous month. VLCC freight rates declined during the month as earnings dropped on the back of high vessels availability. Meanwhile, tonnage demand remained limited in December and transit delays saw a decline, supported by high tonnage availability. Clean tanker spot freight rates strengthened West of Suez as a result of a tightening in vessel supply, mainly in the Mediterranean.
Stock Movements
Total OECD commercial oil stocks fell in November to stand at 2,933 mb. At this level, OECD commercial oil stocks are about 133 mb above the latest five-year average. Crude and product stocks indicate a surplus of around 114 mb and 19 mb above their seasonal norms, respectively. In terms of days of forward cover, OECD commercial stocks stand at 61.8 days in November, some 1.9 days higher than the latest five-year average.
Balance of Supply and Demand
OPEC crude in 2017 is estimated at 32.9 mb/d, which is 0.6 mb/d higher than 2016. In 2018, OPEC crude is projected at 33.1 mb/d, about 0.2 mb/d higher than in the previous year.
Дополнительная информация
- Серия: Международные организации / OPEC / Monthly Oil Market Report
- Год: 2018
- Месяц: 1
- Источник: OPEC
- OPEC: Monthly Oil Market Report - January 2018 - eng (pdf) (477 Скачиваний)


